
Sources & Citations
Data Center Equipment & Infrastructure Market Report 2025-2030
Based on investment allocations from Hyperscalers, the market is forecast to reach $1.01 trillion by 2030.
Data Center Electricity Consumption Projections
International Energy Agency (IEA), "Energy and AI Report" (2025)
https://www.iea.org/reports/energy-and-ai
Global data center consumption: 415 TWh (2024) projected to 945 TWh (2030)
2026-2030 Market Research Report
Equivalent's Smart SVG™ transforms traditional vector assets into intelligent, AI-ready visual objects. The opportunity is to become an infrastructure layer between AI creation systems and the billions of visual assets consumed globally.
Image Weight on Web Pages
HTTP Archive, "Web Almanac 2022: Page Weight"
https://almanac.httparchive.org/en/2022/page-weight
https://almanac.httparchive.org/en/2022/media#images
Images account for roughly 40–50% of total web page weight on average.
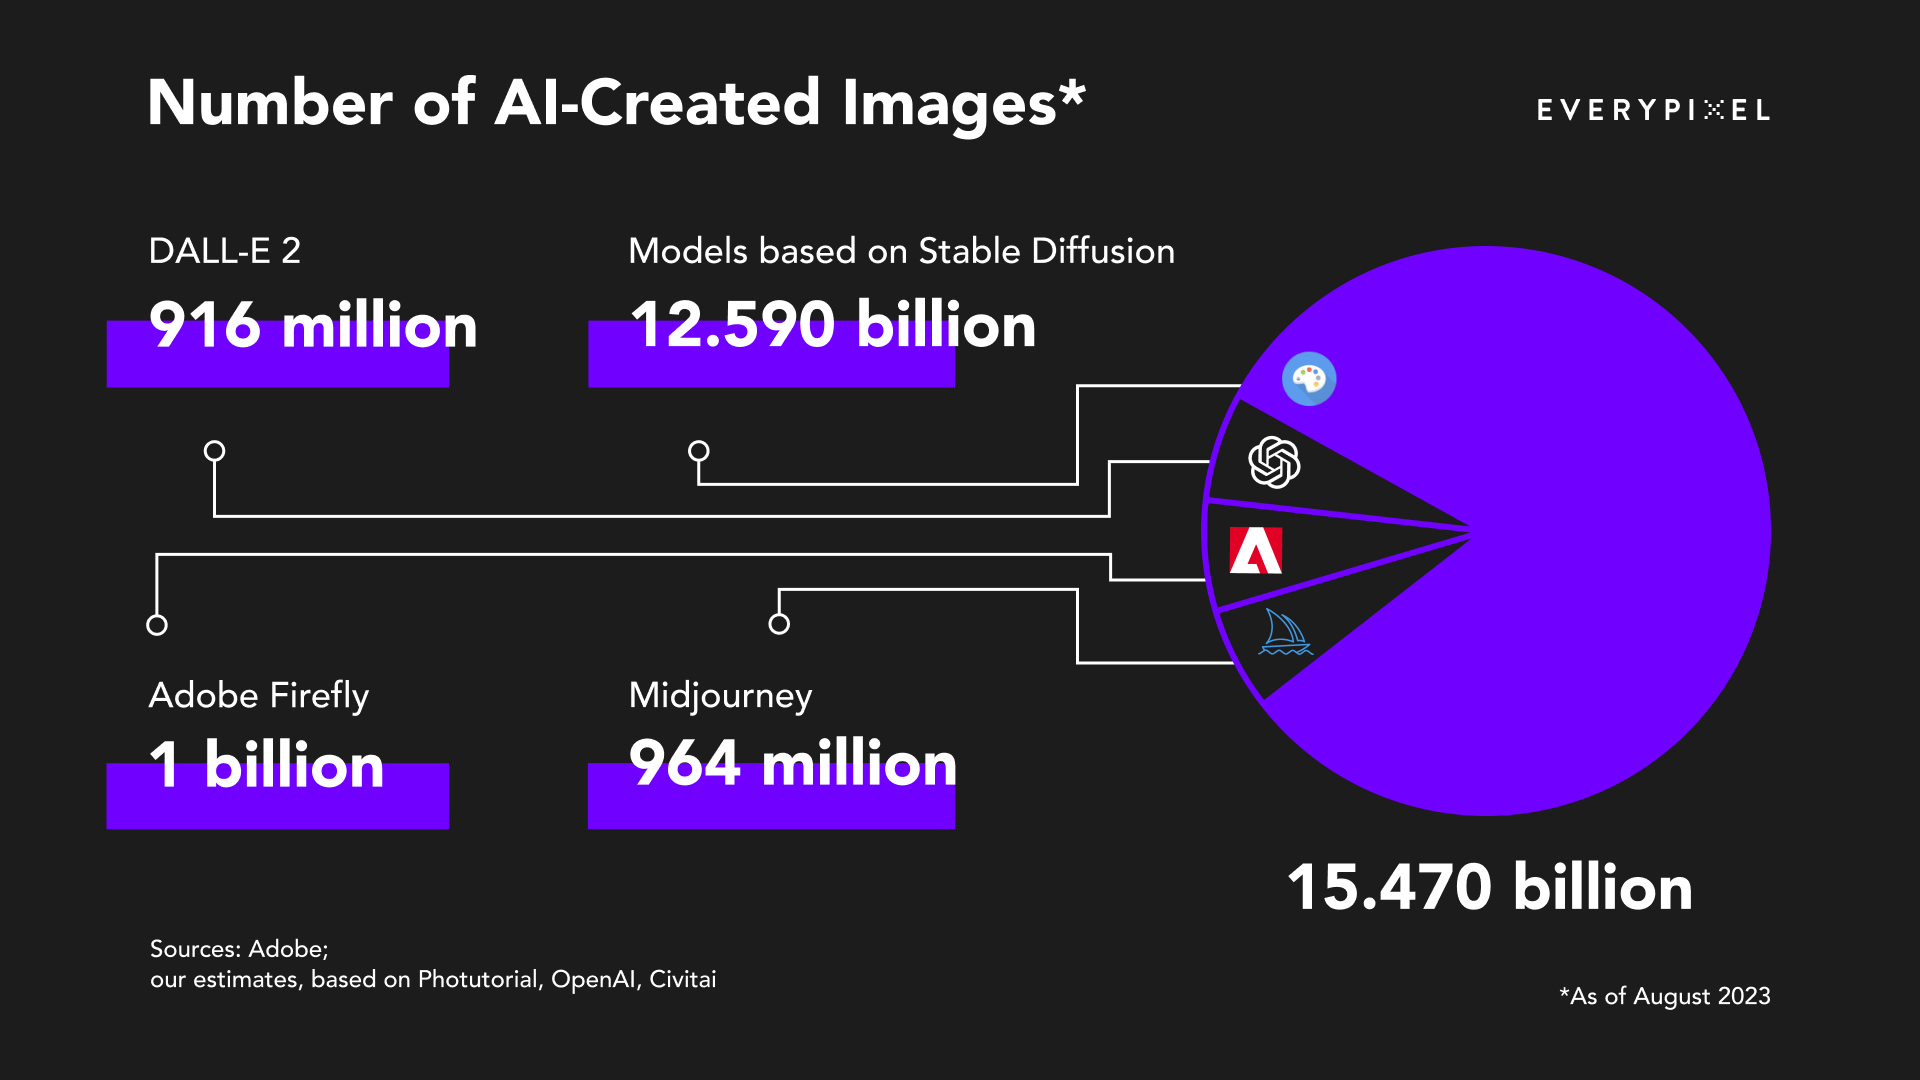
AI creates about 34 million images every single day
(2024) Which is 12B AI generated images yearly.
The global AI image generator market is expected to grow from $257.2 million in 2022 to $917.4 million by 2030. This impressive growth trajectory represents a compound annual growth rate (CAGR) of 17.4%, highlighting the rapidly increasing demand for AI-generated visual content.
A single AI-generated image can consume as much energy as half a smartphone charge (MIT/HuggingFace 2024). “Generating images was by far the most energy- and carbon-intensive AI-based task. Generating 1,000 images with a powerful AI model, such as Stable Diffusion XL, is responsible for roughly as much carbon dioxide as driving the equivalent of 4.1 miles in an average gasoline-powered car.” Multiply this by billions of generations, and "high-fidelity" becomes a massive carbon footprint.
Forbes: 71% Of Social Media Images Now AI-Generated
“Using one of over 2,000 AI image generation tools available online. This staggering daily output represents a fundamental shift in visual content creation, with businesses and individuals increasingly relying on AI to produce everything from marketing materials to conceptual designs without traditional creative constraints or costs.”
The Accessibility Liability: Directive (EU) 2019/882, the European Accessibility Act (EAA) is an EU directive requiring mandatory accessibility standards for key products and services—including e-commerce, banking, smartphones, and computers—to ensure functionality for people with disabilities. Businesses, including non-EU firms targeting EU consumers, must comply by June 28, 2025. Non-compliance may lead to fines and market bans. (up to €100,000 per violation in some EU jurisdictions).
Source: Level Access EAA Non-Compliance
Disability Market a 13T Opportunity
”With an estimated population of 1.85 billion, people with disabilities (PWD) are an emerging market larger than China. Their Friends and Family add another 3.3 billion potential consumers who act on their emotional connection to PWD. Together, disability touches 73% of consumers and controls over $13 trillion in annual disposable income.”
Design, Editing & Rendering Software Market Overview (2025)
Design, Editing & Rendering Software market size has reached to $68.65 billion in 2025.
Expected to grow to $90.43 billion in 2030 at a compound annual growth rate (CAGR) of 5.9%
Inside the Visual Revolution of 2025
The global AI market is worth $279 billion in 2024 and is expected to hit $1.8 trillion by 2030, with image generation playing a major role in creative industries. Source: photogptai.com
Meta Infrastructure Spending
Meta Platforms, Inc., "Q4 2024 Earnings Report" (January 29, 2025)
https://investor.atmeta.com/investor-news/press-release-details/2025/
Full year 2025 capital expenditures: $60-65 billion
Total US investment commitment by 2028: $600 billion
US Data Center Electricity Consumption
Lawrence Berkeley National Laboratory / US Department of Energy
"2024 Report on U.S. Data Center Energy Use"
https://www.energy.gov/articles/doe-releases-new-report-evaluating-increase-electricity-demand-data-centers
4.4% of US electricity in 2023, projected 6.7-12% by 2028
Website Accessibility Failure Rates
WebAIM, "The WebAIM Million - 2025 Report"
https://webaim.org/projects/million/
94.8% of home pages had detected WCAG 2 failures
Missing alternative text for images 55.5% (2025 analysis)
ADA Website Accessibility Lawsuits
EcomBack, "2025 Mid-Year ADA Website Accessibility Lawsuit Report"
https://www.ecomback.com/ada-website-lawsuits-recap-report/2025-mid-year-ada-website-lawsuit-report
2,014 lawsuits filed in first half of 2025, representing 37% increase YoY
Accessibility Widget Lawsuit Statistics
EcomBack, "2025 Mid-Year ADA Website Accessibility Lawsuit Report"
https://www.ecomback.com/ada-website-lawsuits-recap-report/2025-mid-year-ada-website-lawsuit-report
456 lawsuits (22.6%) targeted websites with accessibility widgets installed
FTC Settlement with Accessibility Provider
UsableNet / EcomBack Legal Updates (2025)
https://blog.usablenet.com/2025-midyear-accessibility-lawsuit-report-key-legal-trends
FTC reached $1 million settlement with accessiBe in 2025
Cloudinary Valuation and Revenue
Cloudinary, Official Announcement (February 15, 2022)
https://cloudinary.com/blog/our_2b_valuation
GetLatka, "How Cloudinary hit $94M revenue" (2024)
https://getlatka.com/companies/cloudinary
$2 billion valuation (2022), $94M annual revenue
Imgix Revenue
GetLatka, "How imgix hit $10.4M revenue" (2024)
https://getlatka.com/companies/imgix
$10.4M revenue with 59 person team (2024)
World Economic Forum – Internet energy use and sustainability
The WEF has written about how increasing data use and connectivity drive energy demand and why making the web more efficient matters. They discuss server and network energy and call for sustainable web practices.
Research estimates that by 2025, the IT industry could use 20% of all electricity produced and emit up to 5.5% of the world’s carbon emissions.
Research on digital content impact
A peer-reviewed study in Nature Communications - The environmental sustainability of digital content consumption examines the environmental footprint of internet usage, connecting digital content consumption with carbon budgets and resource use. It highlights that digital behavior (streaming, browsing, etc.) has measurable impacts on energy and carbon footprints.
Wired Article Your website is killing the planet on the internet’s carbon footprint and page weight
According to online carbon calculator Website Carbon, the average website produces 1.76g of CO2 for every page view; so a site with 100,000 page views per month emits 2,112kg of CO2 every year. The more complex a website is, the more energy it requires to load – and the greater its climate impact.
Energy & carbon tracking sites / projects focused on web sustainability
There are initiatives like The Unsustainable Web that model energy use and emissions from data transfer, web page delivery, and content hosting, emphasizing that data movement itself consumes electricity and produces emissions. “Images are the primary culprit of page bloat and have been recorded to take up 1.03 MB/page – nearly half of the average web page’s weight.”
WebAccessBench White Paper on AI Model Accessible Code
TLDR of WebAccessBench: 89.82% of generated UI outputs include detectable accessibility barriers.
Benchmark Results: Accessibility Performance Across AI Models
“Designers want tools that integrate into existing workflows, understand design systems, and support multi-player collaboration across design, engineering, and product.”
What it tested
19 language models generating full web interfaces.
150 tasks each.
Three prompt types: Unguided, “Make it accessible,” and expert accessibility prompts.
Measured with axe-core against WCAG-related defects.
Used absolute error count, zero-error rate, and errors per 100 DOM elements.
Core findings
AI-generated web code is not accessibility-safe.
Overall scores ranged from 11 to 62 out of 100.
Mean overall score: 26.84.
Even under best-of-two runs, error rates remained high.
Interpretation: Current models require human accessibility review.
The new AI Model Accessibility Checker provides something we have been missing. It introduces a benchmark for how well AI models generate accessible code. AIMAC works as an open-source, extensible evaluation framework that tests AI models by sending prompts and analyzing the accessibility of the returned HTML code. The framework features fully customizable prompts, making it adaptable to different use cases—from design and layout to semantic structure. The system generates a comparative score to help users identify which models excel at producing accessible code.
The State of Mobile App Accessibility
A comprehensive report for brand and product leaders to identify trends and opportunities for improvement.
Arc Touch White Paper The State of Mobile App Accessibility 2025.
“Equivalent’s work is absolutely revolutionizing the way visual content is produced to help ensure that every image is not only beautiful but also accessible to everyone.”
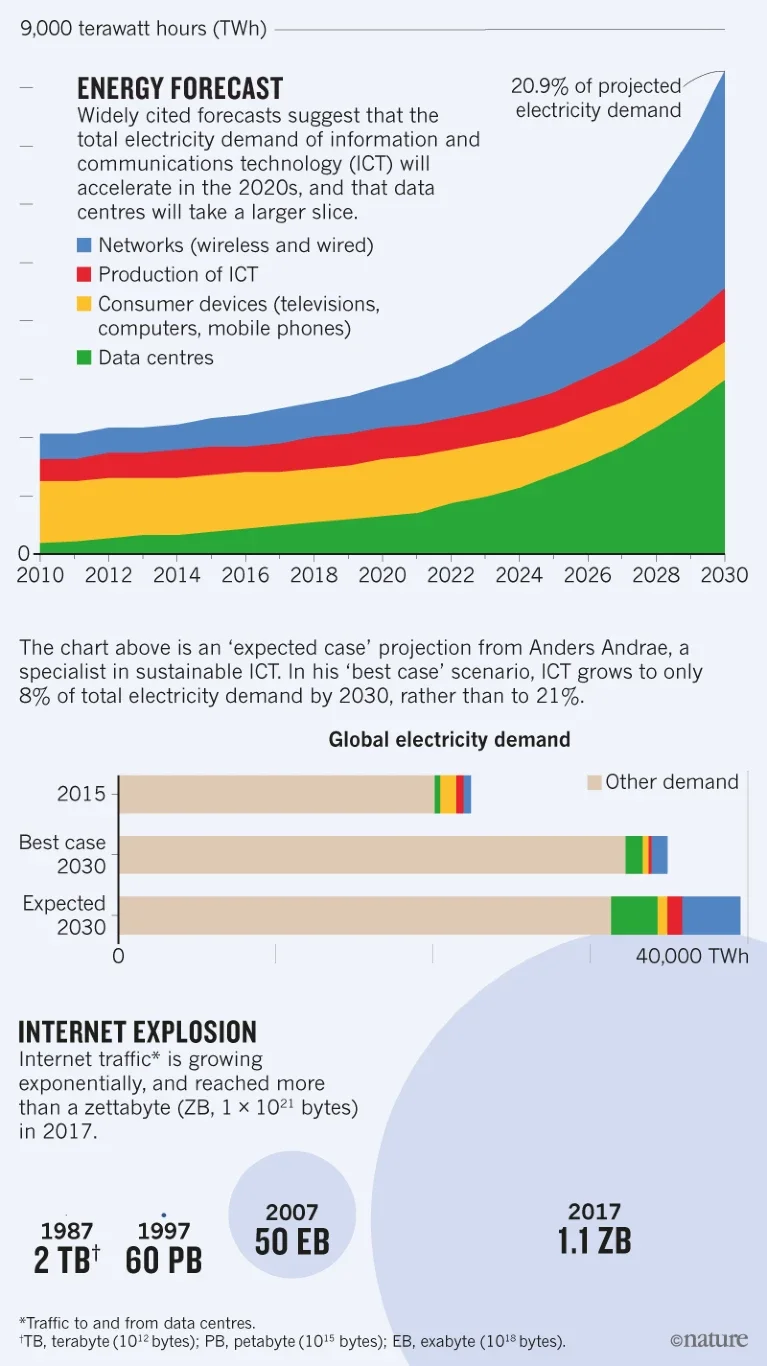
This example should be a Smart SVG as it contains a lot of detailed information which is not given to low vision and blind users as a pixel-based image.
Image description: Infographic about projected electricity demand from information and communication technology, global electricity demand scenarios, and growth in internet traffic.
Section 1: Energy Forecast
Headline: Energy Forecast
Text explains that widely cited forecasts suggest total electricity demand from information and communication technology, ICT, will accelerate in the 2020s, and that data centres will take a larger share.
A stacked area chart shows global ICT electricity use from 2010 to 2030, measured in terawatt hours, up to 9,000 TWh. The categories are:
Networks, wireless and wired
Production of ICT
Consumer devices, including televisions, computers, and mobile phones
Data centres
All categories increase over time, with especially steep growth after 2020. By 2030, ICT is projected to represent 20.9 percent of total projected electricity demand in the expected case.
Caption states that the chart represents an “expected case” projection from Anders Andrae, a specialist in sustainable ICT. In his “best case” scenario, ICT would grow to only 8 percent of total electricity demand by 2030, rather than 21 percent.
Section 2: Global electricity demand
Headline: Global electricity demand
A bar chart compares:
2015
Best case 2030
Expected 2030
Total global electricity demand is shown at roughly 40,000 TWh. Most demand is labeled “Other demand.” Smaller colored segments represent ICT components. In the expected 2030 scenario, ICT takes a significantly larger portion of total electricity demand than in 2015 or the best case 2030 scenario.
Section 3: Internet explosion
Headline: Internet explosion
Text states that internet traffic to and from data centres is growing exponentially and reached more than a zettabyte, defined as 1 × 10^21 bytes, in 2017.
Milestones shown:
1987: 2 TB, terabytes
1997: 60 PB, petabytes
2007: 50 EB, exabytes
2017: 1.1 ZB, zettabytes
Footnote defines units:
TB equals 10^12 bytes
PB equals 10^15 bytes
EB equals 10^18 bytes
Source credited to Nature.
WCAG Compliant Graphics
Our platform streamlines the creation of visually appealing and accessible designs for diverse digital platforms, leveraging innovative Smart SVG™ design technology to enhance user experiences, meet industry standards, and ensure accessibility for all users.
New Legal Compliance Deadlines
With regulatory requirements for digital accessibility tightening, including upcoming deadlines for ADA Title II and the European Accessibility Act June 2025, and April 2026 — ensuring graphics are compliant is a significant challenge for millions of organizations. Many brands currently fail to meet the complex ADA compliance laws, putting them at high legal risk. Designers and developers often struggle with creating accessible brand assets due to a lack of technical know-how, tools, and guidance.
Competitive Advantages
Accessibility is at the heart of our mission, ensuring compliance with strict standards while meeting the growing demand for inclusive digital content. Our Smart SVGs™ not only enhance usability but also reduce energy consumption, making them both accessible and environmentally sustainable. Beyond color adaptability, our platform offers alt-text, responsive layouts, and full cross-browser compatibility, setting a new standard for inclusive digital graphics.
Partnering for Impact
At Equivalent, we collaborate with impact investors who share our vision of making the digital world more accessible and inclusive. Our Smart SVG™ technology transforms how brands approach accessibility, ensuring compliance while enhancing user experience. By working with mission-driven investors, we scale innovation that drives both financial success and measurable social impact. Together, we’re building a future where accessible design is the standard—creating a more inclusive web for everyone.
“I am excited about working with Equivalent to improve the accessibility and efficiency of our graphics using their innovative approach to Smart SVG.”